Welcome to wfmap Documentation

Introduction
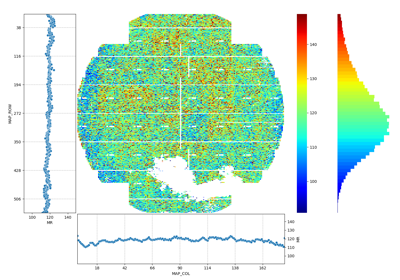
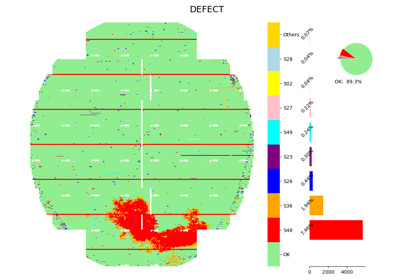
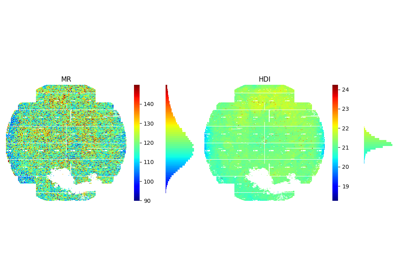
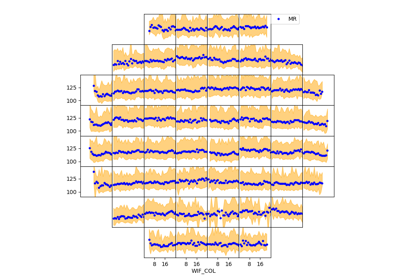
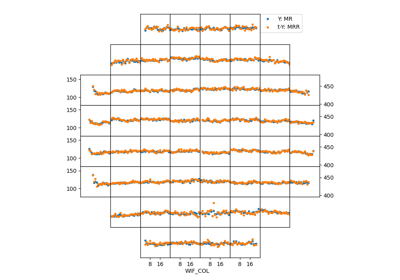
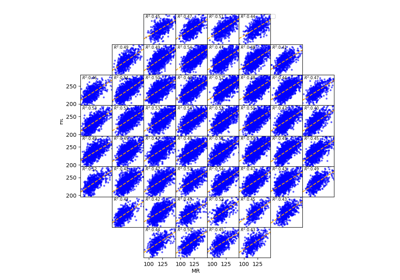
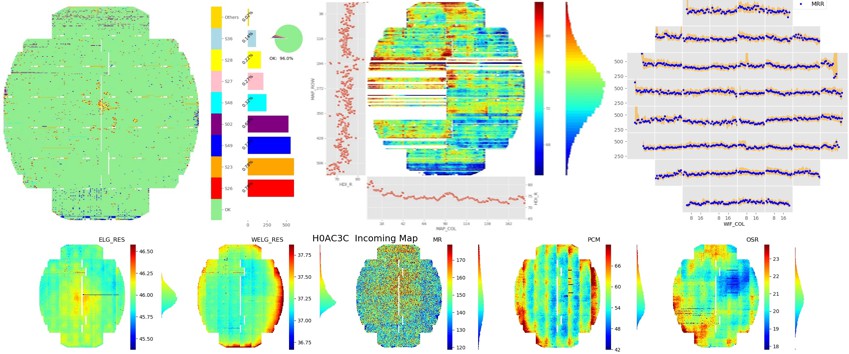
wfmap helps you understand wafer process data better, by presenting the data with heatmap and trend charts by flash field/shot. You can identify abnormal patterns intuitively in a global perspective and make it easier to compare and find potential correlation between different wafer parameters.
This documentation provides comprehensive introduction from Data Preparation to Various Examples. Example Gallery introduces you to the ability to use the APIs of wfmap with the demo data enclosed. You can dive it deeper by reading the API Reference or even the source code. A GUI application WaferViz is also built for non-technical users.
Let’s roll!
Installation
It’s recommended to install wfmap via PyPI using pip:
pip install wfmap
or build the latest build from Github:
git clone https://github.com/xlhaw/wfmap.git
cd wfmap
python setup.py install
A GUI application built with Gooey is also shipped together, you can launch it from command line:
git clone https://github.com/xlhaw/wfmap.git
cd wfmap/gui
pip install -r requirements.txt
python main.py
Tutorials
It’s a good start to learn the basic usage of this package from Example Gallery, which contains various examples from basic heatmap to highly customized wafer map & trend charts. All examples & images were generated by mkdocs-gallery.